|
Statistical modelling/Milk offtake The scatter plot with the two fitted regression lines is produced by clicking the Further output … button in the dialog box shown earlier, then the Graphics Fitted Model … button and finally completing the dialog box below. The graph shows how milk offtake decreases with stage of lactation of cows residing in Bilisa but not at Assa where milk offtakes remain low throughout. 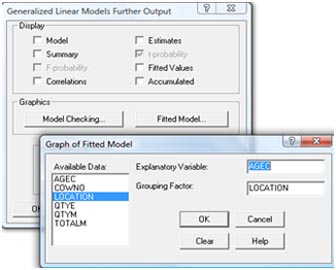 
|
![]()
![]()
![]()